
Prof. Mehari Taddele Maru is a part-time professor at the School of Transnational Governance and the Migration Policy Centre at the European University Institute, Florence, and an Adjunct Professor at Johns Hopkins University School of Advanced International Studies, Bologna.
The global mobility divide is widening significantly. As the Henley Passport Index January 2025 edition reveals, global travel freedom has nearly doubled from 58 visa-free destinations in 2006 to 111 in 2025, but the gap between the most and least mobile nations has reached unprecedented levels. As Dr. Christian H. Kaelin has highlighted, “The global mobility gap between those at the top and bottom of the index is now wider than it has ever been, with top-ranked Singapore able to access a record-breaking 169 more destinations visa-free than Afghanistan.”
This growing mobility disparity is particularly evident in Schengen visa application outcomes. My 2024 research revealed that African applicants face significantly higher rejection rates than the global average. These rejection rates, largely driven by passport power and identity-based visa policies, have more than doubled over the past decade and create substantial barriers to economic mobility for African citizens.
In this edition, following up on my previous analysis, I present three key findings from a data-driven1 comparison of Schengen visa rejection rates between African and Asian countries.2

First, African applicants face consistently higher rejection rates than their Asian and global peers. In 2023, despite submitting half as many applications as those from Asia, African applicants were twice as likely to be rejected, with rates 14 percentage points higher than Asian applicants.
Second, while the strength of the applicant’s passport based on the Henley Passport Index and Henley Passport Power Index, as well as reciprocity agreements, are key factors in Schengen visa access, the variation in rejection rates between regions and nationalities goes beyond economic considerations. Discriminatory policies driven by identity-based electoral processes, broad discretionary powers of immigration officials, and visa sanctions against countries deemed uncooperative in readmitting irregular migrants contribute to higher rejection rates for certain nationalities, ultimately reducing legal mobility.
Third, these regional disparities between the Global North and Global South, and between Africa and Asia, reveal how visa policies contribute to a rapidly widening mobility gap in a world where travel freedom is expanding selectively, creating a system where some nationalities enjoy greater mobility while barriers grow for others.
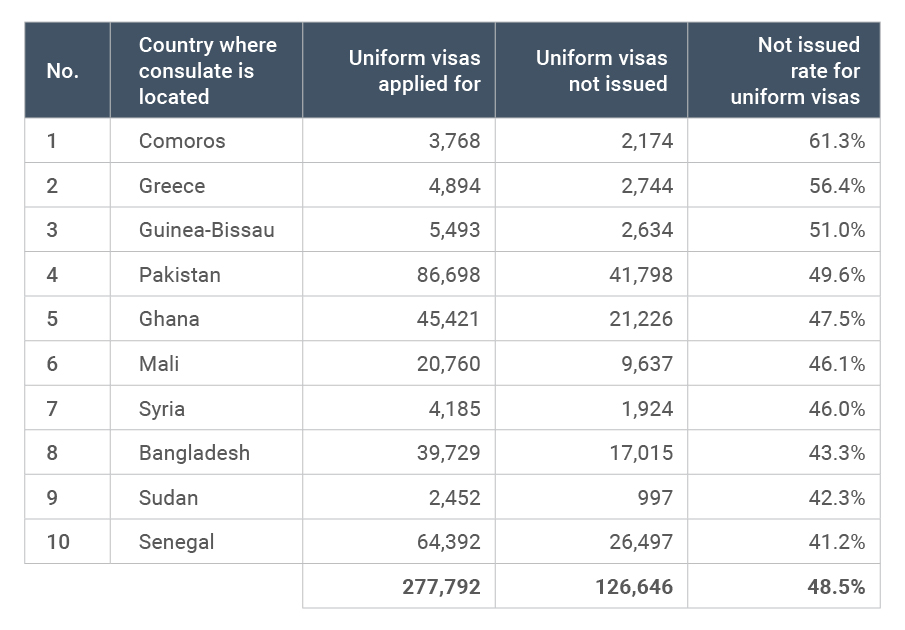
Table 1. World Top 10 Countries with Highest Schengen Visa Rejection Rates in 2023
Source: Compiled by Author using data from European Commission – Migration and Home Affairs, May 2024
Among the top 10 countries facing the highest Schengen visa rejection rates illustrated in Table 1, six are in Africa. Comoros leads with a 61.3% rejection rate, followed by Guinea-Bissau at 51%, Ghana at 47.5%, Mali at 46.1%, Sudan at 42.3%, and Senegal at 41.2%. Three Asian countries and a European country complete the list: Pakistan with 49.6%, Syria with 46%, and Bangladesh with 43.3%. Greece, despite being a European Union member and part of Europe’s Schengen area, holds the second-highest rejection rate at 56.4%. Although not in the global top 10, it is worth highlighting the UAE, which the UN classifies as an Asian country, where European consulates reported a 22.8% rejection rate in 2023, placing it among Asia’s highest. These high rejection rates in Greece and the UAE are largely attributed to applications from non-citizens of the countries.
Schengen visa rejection rates vary significantly between the countries with the highest rejection rates and the global average. In 2023, the top 10 countries globally faced a 48.5% rejection rate, despite accounting for only 2.7% of all applications. Similarly, the top 10 African countries, while submitting only 2.8% of global Schengen visa applications, faced a rejection rate of 44.8%. Half of the 277,792 applicants from the top 10 countries with the highest rejections were denied visas. Although these countries represent just 2.7% of total applications, the rejection rate of 48.5% — almost one in two applications — stands in sharp contrast to the global average, where only one in six from a total of over 10 million applications is rejected.
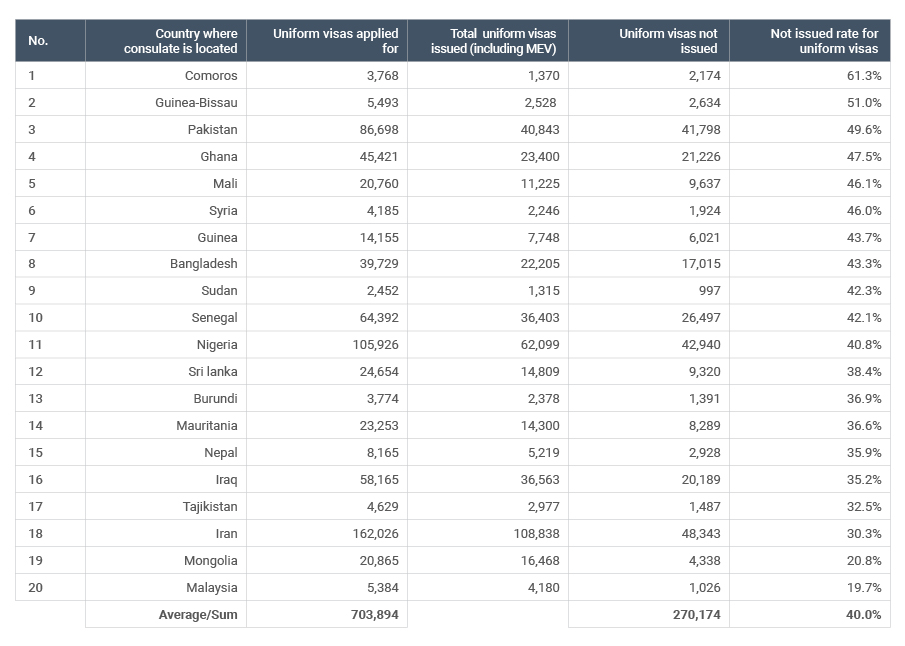
Table 2. Top 20 African and Asian Countries with Highest Schengen Visa Rejection Rates in 2023 by Percentage
Source: Compiled by Author using data from European Commission – Migration and Home Affairs, May 2024
Looking at broader regional patterns in 2023, as Table 2 reveals, the top 20 countries in Africa and Asia submitted 703,894 applications, representing 6.8% of all Schengen visa applications, of which 40% were rejected. The top 10 African countries faced particularly high rejection rates, with applicants experiencing a 45% rejection rate, higher than the combined Africa–Asia average of 40% (see Table 3).
Table 3. Total Schengen Visa Applications 2013–2023: Comparing Africa, Asia, and Global

Source: Compiled by Author using data from European Commission - Migration and Home Affairs, May 2024
Table 3 shows that while in 2013, African applicants faced a rejection rate of 18% — 13 percentage points higher than the global rate of 5%, by 2023, the rejection rate for African applicants had risen to 27%, 11 percentage points higher than the global average of 16%. The 10-year difference in rejection rate of 2 percentage points shows a slight narrowing of the gap between African and global Schengen visa rejection rates.
The rejection rate for Schengen visa applications from Africa increased from 18% in 2013 to 27% in 2023 — a 9-percentage point rise, while, the global rejection rate increased by 11 percentage points, from 5% in 2013 to 16% in 2023. In a nutshell, the likelihood of African applicants for Schengen visas being rejected is 11% higher than the global average.
The contrast between regional Schengen visa rejection rates is striking. Over the period 2013 to 2023, rejection rates increased across regions, with African rates rising by 9% and Asian rates by 7%, following the global trend of an 11% increase.
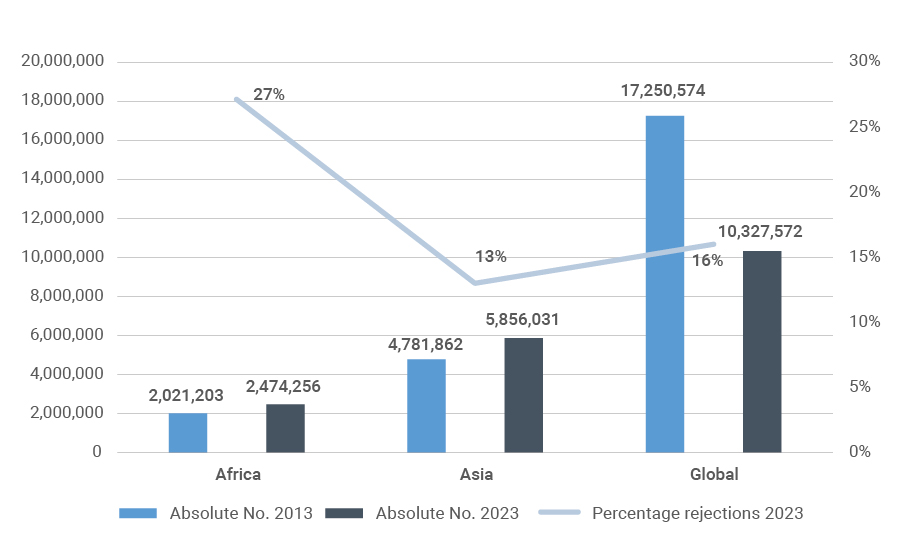
Graph 1. Schengen Visa Applications 2013–2023, Absolute Number and Rejection Rate: Comparing Africa, Asia, and Global
Source: Compiled by Author using data from European Commission – Migration and Home Affairs, May 2024
Graph 1 illustrates that between 2013 and 2023, the total number of Schengen visa applicants from Asia (5.9 million) was more than double that of applicants from Africa (2.5 million). However, the rejection rate for applications from Africa (27%) was more than double that of those from Asia (13%). The disparity is clear in the annual figures shown in Table 2: in 2013, 18% of applications from Africa were rejected, compared to only 6% of applications from Asia. By 2023, the gap between African and Asian rejection rates widened, with African rejections rising to 27% compared to Asia’s 13%, despite Asia submitting 3.4 million more applications. The gap between African and Asian rejection rates grew from a difference of 12 percentage points in 2013 to one of 14 percentage points in 2023 — an increase in disparity of 2 percentage points. This growing gap in Schengen visa rejection rates reflects the broader pattern of global mobility inequality, placing African citizens at a greater disadvantage in accessing economic opportunities.
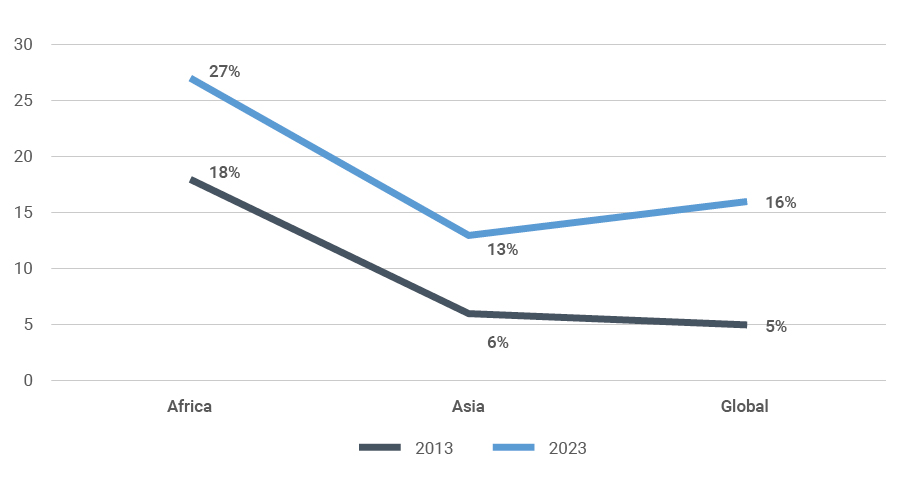
Graph 2. Schengen Visa Rejection Rates 2013 vs 2023 in Percentage: Comparing Africa, Asia, and Global
Source: Compiled by Author using data from European Commission – Migration and Home Affairs, May 2024
As Graph 2 illustrates, in 2013, Asian applicants faced a rejection rate just 1 percentage point higher than the global rate of 5%. However, by 2023, the rejection rate for Asian applicants rose to 13% — 3 percentage points lower than the increased global rate of 16%.
As mentioned above, the cases of the UAE and Greece (a member of the European Union) demonstrate that rejection rates are more closely tied to the nationality and identity of the applicants rather than their economic status. In 2023, despite being one of the world’s wealthiest nations, the UAE saw a 22.8% rejection rate for its 233,932 Schengen visa applications (2.3% of global applications). Notably, over 90% of these rejections were for non-Emirati UAE residents, including applicants from Egypt, India, Jordan, Philippines, Russia, and South Africa. Similarly, Greece, a member of Europe’s Schengen area, recorded a striking 56.4% rejection rate for the 4,894 applications made in the country, most of which were made by non-Greek residents or tourists.
Several factors explain the variation in rejection rates between regions and countries. The disparities in Schengen visa access can be significantly explained by the Henley Passport Index and Henley Passport Power Index, where the main determinants of visa access are the GDP per capita of the nationality and the bilateral agreements and free movement policies in place among countries. However, the differences observed cannot be justified and fully explained by economic factors and reciprocity agreements alone. Identity politics, far-right political influence, and fears about demographic changes play significant roles, alongside historical migration patterns and cultural diversity concerns.
Migration policy has become a primary tool for addressing domestic political pressures driven by anti-immigration sentiments. Discriminatory policies often emerge from electoral processes dominated by identity politics and the desire to maintain specific socio-cultural demographics in destination countries. Such policies manifest in the discretionary power of immigration officials to assess the credibility of applicants and their intention to return. Additionally, the visa sanctions regime, which imposes longer processing times for countries deemed uncooperative in the return and readmission of nationals staying irregularly in Europe, also contributes to reduced legal mobility and potentially higher rejection rates.
However, irregular stay rates alone fail to explain high rejection rates. For example, 35.5% of applications from Malta are rejected despite the country having only 147 irregular migrants per 100,000 residents, compared to Slovenia, which has 1,667 irregular migrants per 100,000 and a rejection rate of 17.4%.
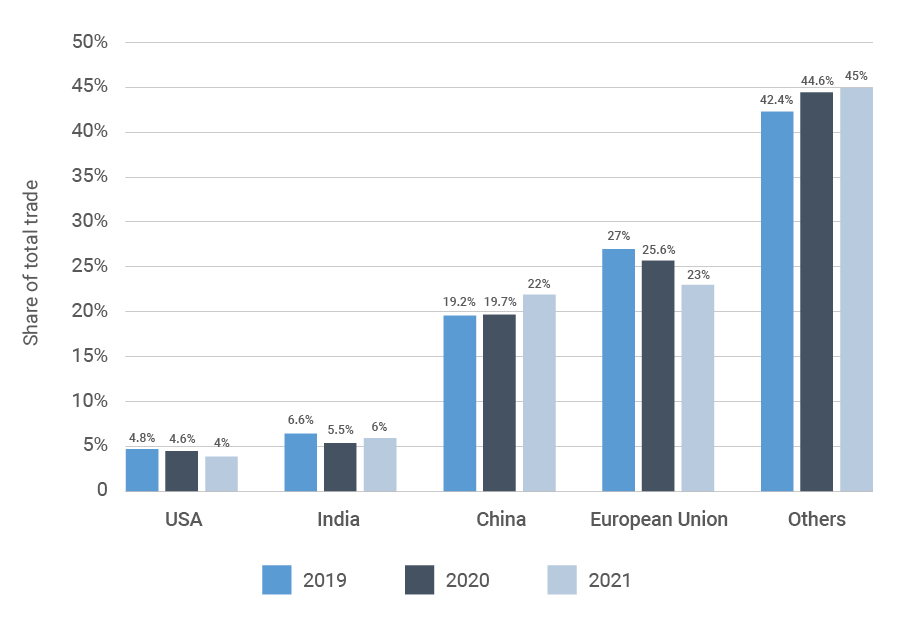
Graph 3. Africa’s Leading Trade Partners, 2019–2021
Source: Compiled by Author based on data from Afreximbank and IMF
Between 2013 and 2023, the number of global Schengen visa applications fell by 40.13% (from 17.3 million to 10.3 million), while visa fees increased by 50% (from EUR 60 to EUR 90), and rejection rates rose by 12%. Contrary to this global trend, as shown in Table 3, African applications increased by 22.41% (from 2.02 to 2.47 million), despite facing consistently higher rejection rates than other regions, particularly Asia.
These high rejection rates contradict established migration theories and existing Africa–European Union migration partnership agreements. Various factors and migration theories suggest there should be robust mobility between Africa and Europe: high trade volume (the European Union remains Africa’s leading trading partner), geographic proximity, demographic complementarity, historical connections, and linguistic ties. Migration theories including network theory, as discussed by Massey et al. (1993), demonstrate how African migrant networks typically help lower migration costs and risks by providing social capital that facilitates movement. The Gravity Model of Migration developed by Stewart (1948) suggests that migration volume between regions should be inversely proportional to the distance between them, thus higher mobility should exist between Europe and Africa. Additionally, the Demographic Transition Theory by Thompson (1929) and Notestein (1945) points to demographic complementarity between the regions, as population growth and changing age structures create natural migration pressures where Europe’s demographic decline and Africa’s youthful demography would be expected to complement each other.
Moreover, while the European Union, though declining as shown in Graph 3, remains Africa’s leading trading partner, legal mobility of Africans to Europe is, paradoxically, increasingly restricted. The promise of legal mobility from Africa to Europe, which has been a critical demand from Africa and a pillar of the Africa–Europe partnership on migration and mobility, remains as elusive as Godot.
What is more, current European Union migration policies appear to increase both the human and economic costs of travel to Europe, whether through regular or irregular channels. This is evidenced by the fact that the Central and Western Mediterranean have been the deadliest migration routes in the world, along with ever-increasing Schengen visa fees and associated costs.
Instead, current visa policies increase both human and economic costs of travel to Europe, contributing to the already declining share of trade, and reducing educational and cultural exchanges. These restrictive policies, driven by domestic and geopolitical identity politics and ideological considerations, contradict the European Union’s commitment in the African Union–European Union partnership to take concrete actions and allocate resources to expand legal migration pathways. Consequently, they are widening the mobility gap, and particularly disadvantaging African nationals.
Notes
1 The data for this piece is mainly taken from Migration and Home Affairs – European Commission. 2024. “Short-stay visas issued by Schengen countries”. Accessed November 2024: home-affairs.ec.europa.eu/policies/schengen-borders-and-visa/visa-policy/short-stay-visas-issued-schengen-countries_en
2 This piece uses UN and African Union regional classification as provided here: un.org/dgacm/en/content/regional-groups
Henley & Partners assists international clients in obtaining residence and citizenship under the respective programs. Contact us to arrange an initial private consultation.

Have one of our qualified advisors contact you today.
We use cookies to give you the best possible experience. Click 'Accept all' to proceed as specified, or click 'Allow selection' to choose the types of cookies you will accept. For more information, please visit our Cookie Policy.